Using New Relic to Troubleshoot Magento Performance Problems
We are pleased to announce that New Relic Application Performance Monitoring (APM) is now available on our hosting platform! New Relic is already installed on our shared hosting servers and can be installed on our dedicated servers/cloud servers upon request.
New Relic is an application performance and monitoring suite that makes it easy to diagnose and debug performance issues on your website. With New Relic you get valuable insight into your website health. Real-time web transaction times and historical data makes it easy to monitor how your website performs, allowing you to take actions quickly if a problem arise. You can even set up alerts to notify you immediately at certain thresholds.
Some of the features you get with New Relic:
- Web transactions time: with a quick glance see how well your website performs. New Relic not only monitors home page load time, but all areas of your website including critical functions such as a checkout process or email opt-in form.
- Transaction throughput: is your server able to keep up with the traffic? Watch your throughput carefully and upgrade before it becomes a problem.
- Slow MySQL queries: not only will New Relic give you the page response time. It will also show you exactly how much time is spent waiting for a SQL query to finish or waiting for an external web service to respond. This information is invaluable when it comes to optimizing your Magento codebase.
- Application code profiling: use New Relic to drill down into specific code segments or SQL queries to identify issues that normally are very difficult to find. New Relic will pinpoint the exact line of code that is causing you headache.
- Key transactions: Flag your most critical transactions to quickly spot when things like response times, call counts, or error rates perform poorly. For a Magento site this would typically be the Add to Cart function or checkout.
- Apdex user satisfaction scoring: a simplified SLA solution, Apdex measures the ratio of satisfactory response times to unsatisfactory response times and provides a score that gives you better insight into how satisfied users are.
In this blog post we will show of how we can use New Relic to identify and fix a performance problem within a Magento ecommerce site, and also how it can be used to track the performance of your website over time by the help of key transactions tracking. Some of the features mentioned in this article requires New Relic Pro edition. New Relic is available at different subscription levels. To get started, you can sign up for a 14-day trial.
Enable New Relic integration
The first step we need to do is to instruct our website to report data to New Relic. If you are on a ProperHost Magento hosting server we already have the New Relic PHP extension installed, so all you need to do is activate it in .htaccess:
php_value newrelic.enabled yes
php_value newrelic.license "INSERT_YOUR_LICENSE_HERE"
php_value newrelic.appname "INSERT_APP_NAME"
You can find the license key from your New Relic control panel (APM > New PHP Application > Reveal License Key or under Account Settings).
The app name is an arbitrary label which is used to identify the site within the APM interface if you host multiple websites.
After adding the above, New Relic should start collecting metrics and data will show up in your account after a few minutes.
Finding the performance bottleneck
Scenario: customers of our fictitious Magento store have recently reported problems of slow loading pages and not being able to complete their orders. We have also noticed an increase in abandoned carts from our analytics data. For an ecommerce site it is crucial that the checkout process works flawlessly so we turn to New Relic to diagnose the problem. In a complex system such as Magento, finding the piece of code that is responsible for the performance problem can be a challenging task even for an experienced developer, but fortunately New Relic makes it really simple!
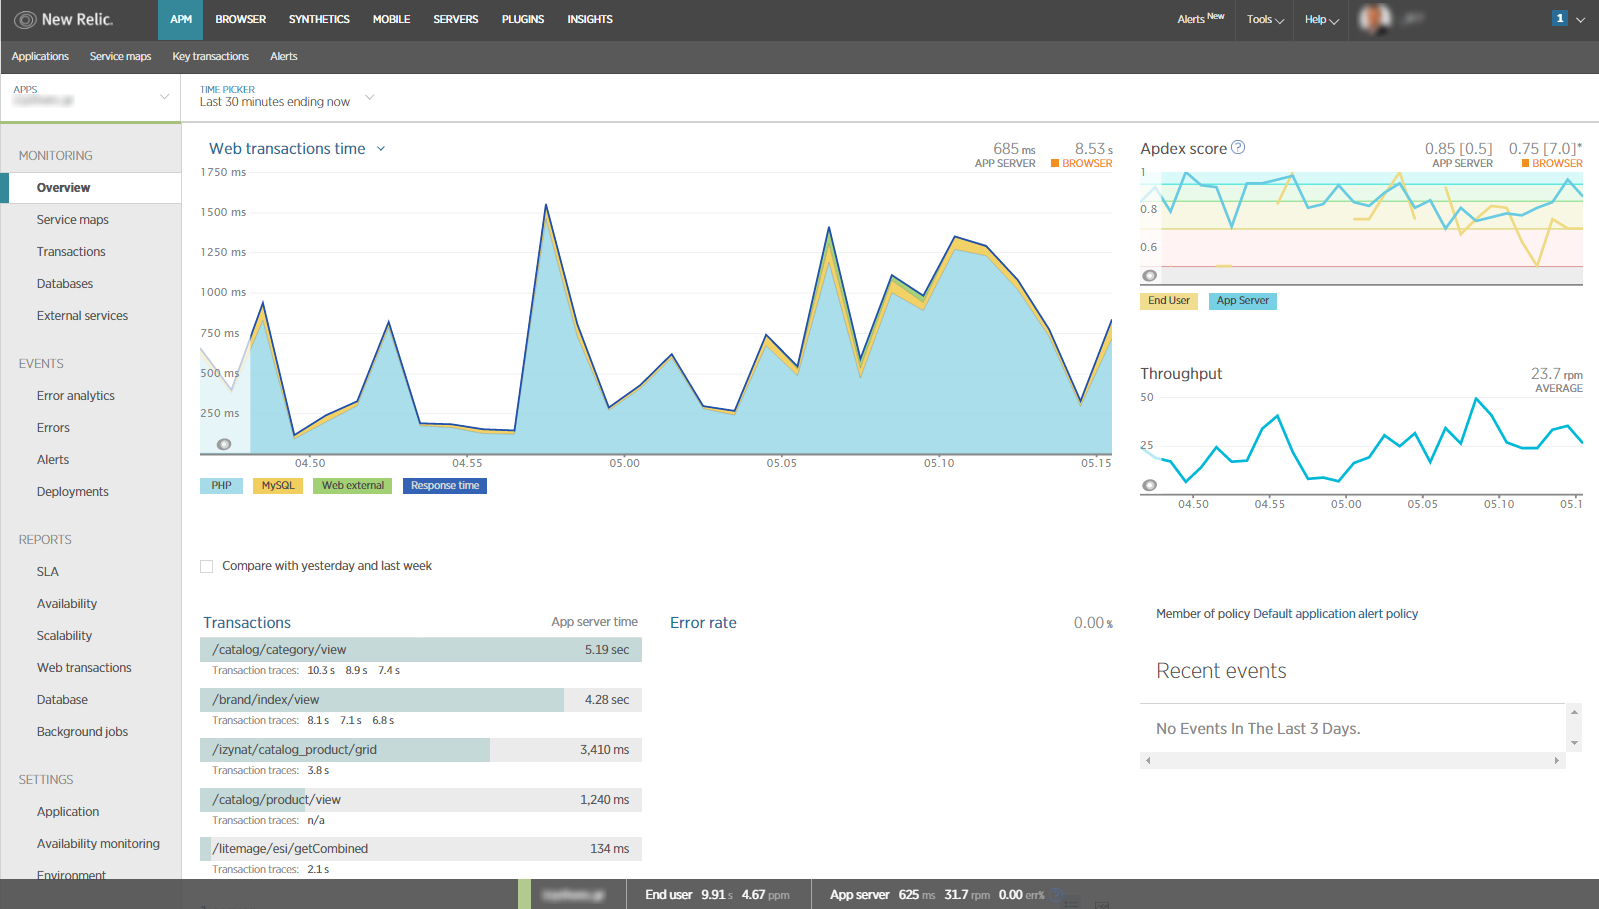
We use the APM (Application Performance Monitoring) feature in New Relic to monitor the response time of our web site. The main overview gives you a few key metrics about how well your application is performing, such as the average page load time, application server response time and application throughput.
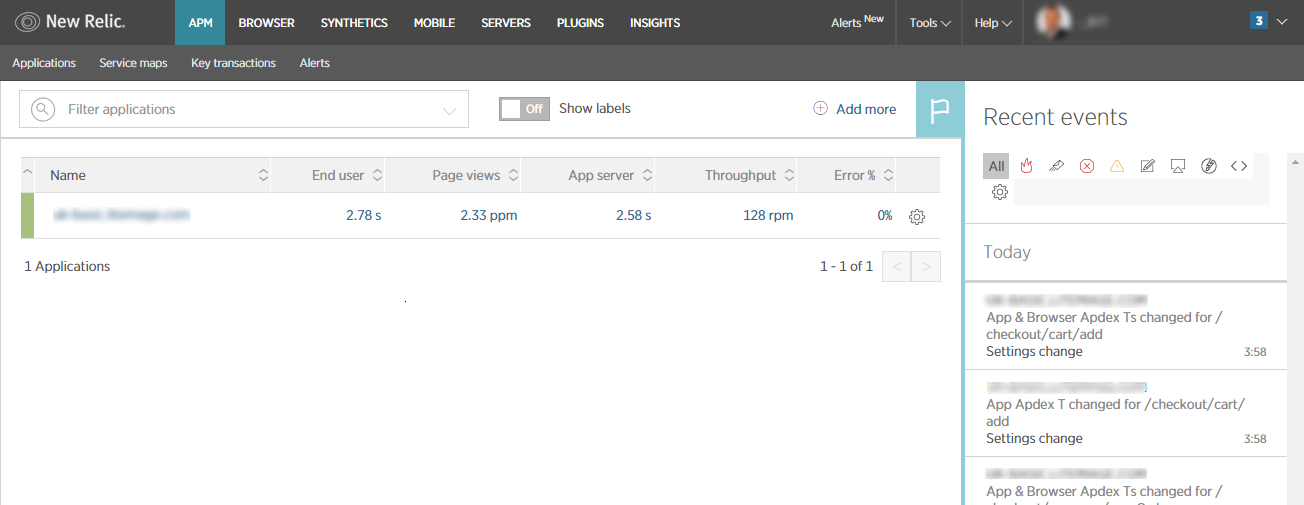
Click on the application name to show more detailed performance statistics for this application. We are interested in the poorly performing transactions, so we click on Transactions and sort the list by "Slowest average response time". In terms of web applications, a transaction can be thought of as a single request that is processed on the server. New Relic can monitor other type of transactions as well, such as database queries or external web service calls, but in the scope of this tutorial we focus only on web transactions.
![]()
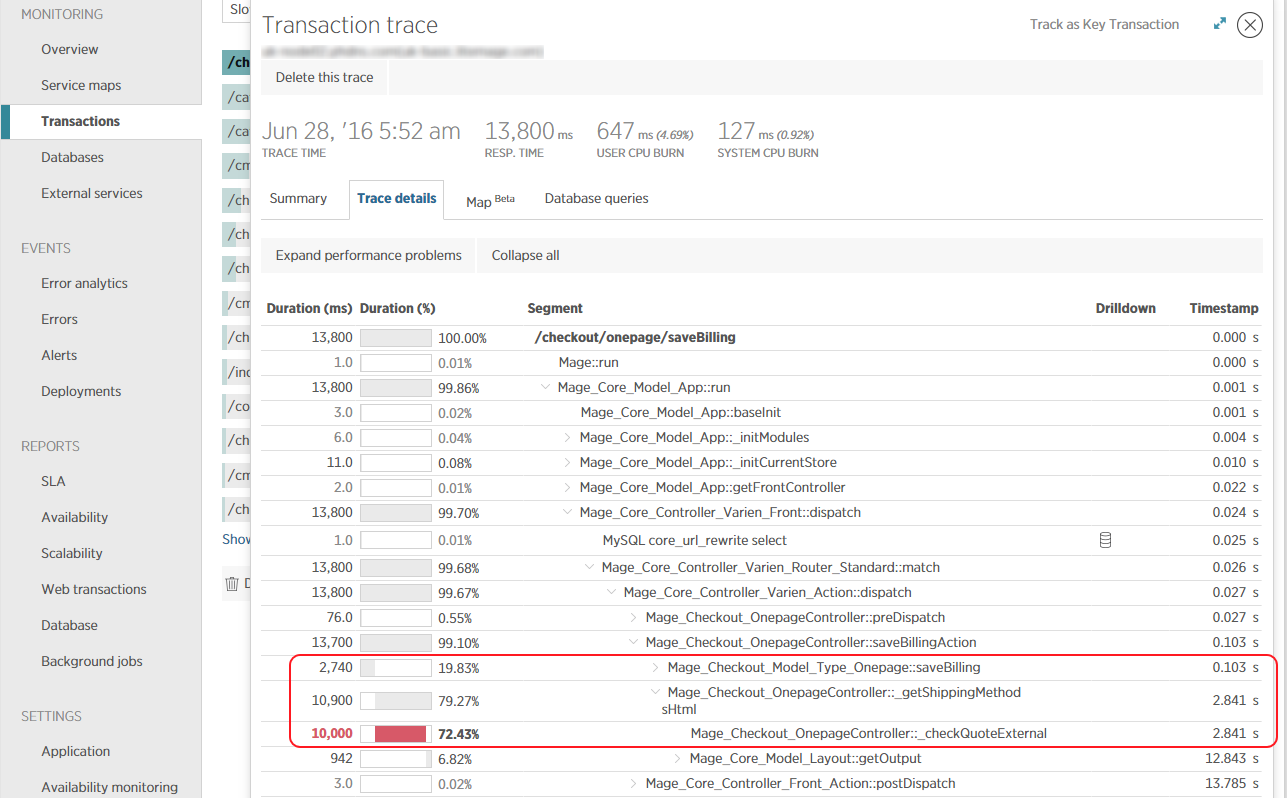
We can see that the transaction /checkout/onepage/saveBilling takes on average more than 13 seconds to complete. This is seriously affecting the customer experience and we need to fix this as soon as possible to avoid losing more sales. Below the Transaction traces you will find the recent transactions matching this url and how long it took to process the request.
![]()
![]()
Next we click on the link "/checkout/onepage/saveBilling" to bring up the Transaction Trace for that url. As we see almost all of the time is spent in the Mage_Checkout_OnepageController::_checkQuoteExternal component. Now click on Trace Details to reveal the complete call tree. We can see that the function _checkQuoteExternal is called from the _getShippingMethodsHtml function in the OnepageController each time the saveBilling action is invoked. This is causing our checkout page to perform poorly.
As a developer we can now inspect the OnepageController, which is located in the file ./app/code/core/Mage/Checkout/controllers/OnepageController.php. The relevant code segment is highlighted below:
protected function _getShippingMethodsHtml() {
	$this->_checkQuoteExternal();
	$layout = $this->getLayout();
	$update = $layout->getUpdate();
	$update->load('checkout_onepage_shippingmethod');
	$layout->generateXml();
	$layout->generateBlocks();
	$output = $layout->getOutput();
	return $output;
}

private function _checkQuoteExternal() {
	sleep(10);
}
As you can see from the above we have added a sleep function inside the code to simulate a performance bottleneck. In a real-world scenario this could for example have been a remote call to a shipping provider or a slow SQL query responsible for the delay.
Tracking key transactions
In web applications, some web transactions are more important to the business than others, and should be monitored with precision. They include key business events in your application (such as sign ups or purchase confirmation) and/or transactions that are particularly important from a performance perspective (such as search or login).
In New Relic, Key Transactions let you closely monitor these important key business transactions and receive alerts when they are performing poorly.
As store owners we obviously want to make sure customers are able to add products to their cart and complete their purchases, so we identify the following two key transactions:
/checkout/cart/add
/checkout/onepage/saveOrder
Let's go ahead and track these in New Relic. From the APM tab, we click on Transactions and select the above transactions one by one, then click on Track as key transaction in the right pane.
![]()
These transactions can now be monitored from the Key transactions menu in the top bar. From this section one can also edit the alert policy to automatically be notified via email or phone if certain conditions are met, such as a dissatisfying Apdex score or an increasing server error rate. This way you become aware of any issues before your users notice them.
![]()
New Relic Reporting from Magento
For an even deeper integration between Magento and New Relic you can enable New Relic reporting in Magento, and have your store send data and events back to New Relic. For example, the Deployments feature in New Relic is useful to reveal what impact certain code changes (a deployment) have on yoursite's performance. You'll quickly see whether the deployment had a positive or negative impact on Apdex, response time, throughput, or errors.
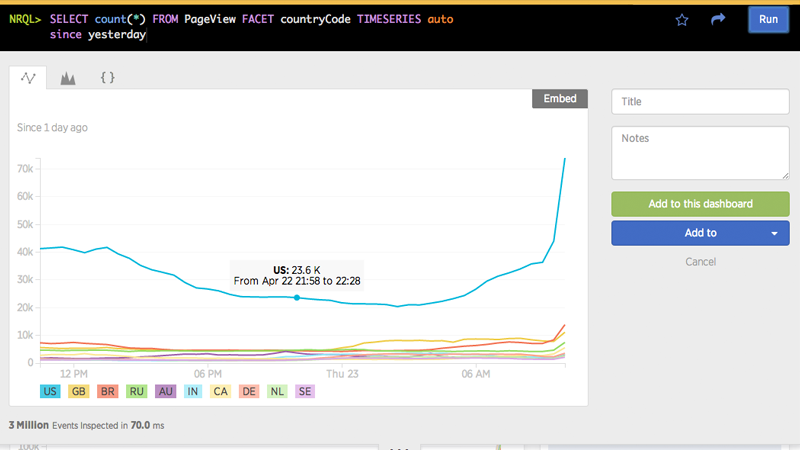
You can also use New Relic Insights to analyze and visualize data in real-time, helping your team make faster and better decisions.
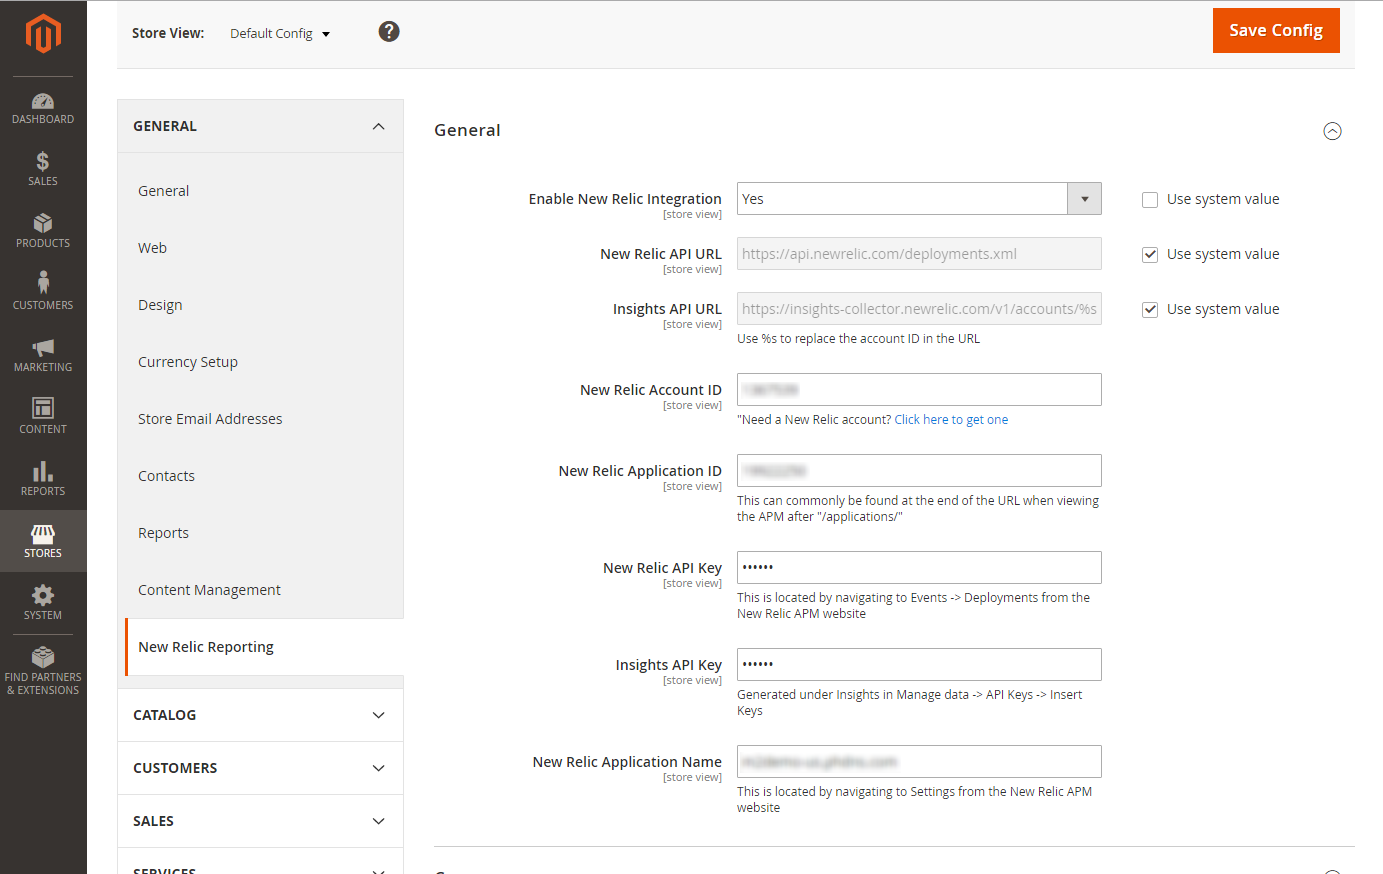
Magento 2 has built-in support for New Relic Reporting so it is only a matter of enabling it in Stores > Configuration > New Relic Reporting. For Magento 1.x a number of extensions are available that provide similar functionality.
Conclusion
In this article we have shown how New Relic can be used to monitor website performance and gain useful insight into your web sites’ health. For developers, New Relic is an invaluable tool that helps to debug application code and pinpoint the root cause of performance problems, even in a production environment. For more information, visit newrelic.com and sign up for a free 14-day trial now.